BreakingIndia vs WorldExplainerVerified
India puts 0.65% of GDP into research, China 2.58%: where India really stands against the world in tech, defence and youth
259 researchers per million vs China’s 2,107; #1 arms importer among 7 big countries; 25.6% of youth not in work or study — and a working-age share that keeps rising till 2036. Official data only.
Where does India really stand against China, the United States, Europe, Japan, Russia and other big countries in technology, defence and the skills of its young people? This report answers only with official, comparable data — the World Bank’s World Development Indicators (which carry UNESCO, WIPO, SIPRI, ILO and ITU figures) — and with Government of India releases on what the country is building. Where no comparable official data exists, we say so instead of guessing.
Data refreshed 28 October 2026. Each figure shows the latest year available for that country, in brackets — countries report at different speeds, so years can differ.
The short answer
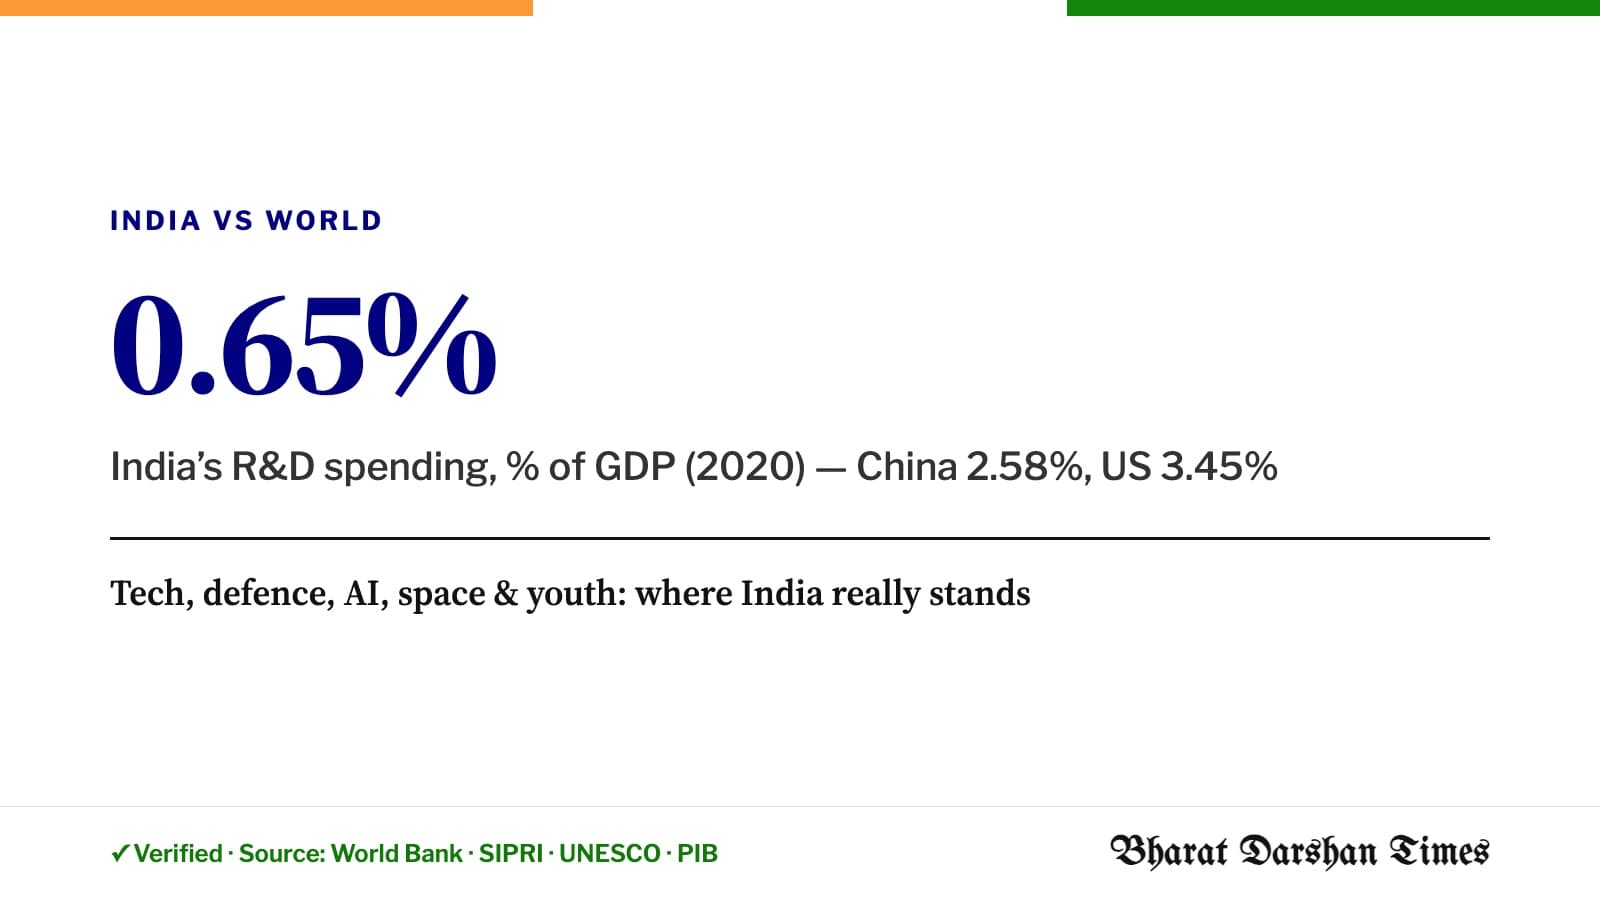
- Research spending: India spends 0.65% of GDP on research and development (2020), against 2.58% in China, 3.45% in the US and 4.94% in South Korea. The world average is 2.60%.
- Researchers: India has 259 researchers per million people (2020); China has 2,107, the US 4,937, South Korea 9,472.
- Science output is large: Indian authors published 2,28,174 scientific articles in 2023 — #3 of 7 countries here — and Indian residents filed 63,217 patent applications in 2024 (#5 of 7; China: 1.67 mn).
- Defence: India spent $92.1 bn on its military in 2025 (2.30% of GDP), #4 of 7 here. It remains a major arms importer — #1 of 7 countries in this table by SIPRI import volume — while its arms exports are much smaller.
- Youth: 16.0% of young Indians (15–24) in the labour force are unemployed (World: 13.4%), and 25.6% are not in education, employment or training (2025).
- Next 10 years: by the UN-based World Bank projections, the share of working-age people (15–64) rises between 2026 and 2036 only in India and Russia among the economies here. India’s goes from 68.6% to 69.1%, while China’s falls from 70.1% to 66.9%.
1. Research and innovation
| Country | R&D, % of GDP | Researchers per million | Resident patent applications | Science & engineering articles |
|---|---|---|---|---|
| India | 0.65 (2020) | 259 (2020) | 63,217 (2024) | 2,28,174 (2023) |
| China | 2.58 (2023) | 2,107 (2023) | 1.67 mn (2024) | 9,32,712 (2023) |
| United States | 3.45 (2023) | 4,937 (2022) | 2,70,295 (2024) | 4,30,843 (2023) |
| European Union | 2.26 (2023) | 4,741 (2023) | — | 5,58,077 (2023) |
| Japan | 3.44 (2023) | 5,609 (2023) | 2,37,169 (2024) | 96,543 (2023) |
| Russia | 0.94 (2024) | 2,639 (2024) | 21,502 (2024) | 85,558 (2023) |
| South Korea | 4.94 (2023) | 9,472 (2023) | 1,95,786 (2024) | 71,724 (2023) |
| United Kingdom | 2.68 (2023) | 4,473 (2017) | 11,105 (2024) | 97,536 (2023) |
| World | 2.60 (2023) | 1,652 (2020) | 2.70 mn (2024) | 3.27 mn (2023) |
What this means: China spends about 4.0 times India’s share of GDP on research, and the US about 5.3 times. India’s scale — a huge number of papers and a rising number of patents — comes from a very large population; per person, it has far fewer researchers.
Chart · India in Data
Spending on research and development
0.65
% of GDP · 2020
▼ −0.01 vs 2019 · worse
- India
- World
Source: World Bank, World Development Indicators (UNESCO Institute for Statistics) · Checked 28 Oct 2026, 11:15 PM IST
Chart · India in Data
Researchers in R&D
259
per million people · 2020
▲ +9 vs 2018 · better
- India
- World
Source: World Bank, World Development Indicators (UNESCO Institute for Statistics) · Checked 28 Oct 2026, 11:15 PM IST
2. Selling technology to the world
| Country | High-tech exports | High-tech, % of manufactured exports |
|---|---|---|
| India | $54.1 bn (2024) | 18.6 (2024) |
| China | $856.8 bn (2024) | 26.3 (2024) |
| United States | $232.9 bn (2024) | 24.3 (2024) |
| European Union | $966.7 bn (2024) | 20.6 (2024) |
| Japan | $102.5 bn (2024) | 17.6 (2024) |
| Russia | $10.6 bn (2021) | 9.7 (2021) |
| South Korea | $216.2 bn (2024) | 36.3 (2024) |
| United Kingdom | $84.8 bn (2024) | 29.2 (2024) |
| World | $3.58 trn (2023) | 24.7 (2024) |
India’s high-technology exports were $54.1 bn in 2024, or 18.6% of its manufactured exports. China’s were $856.8 bn — about 15.8 times larger.
Chart · India in Data
High-technology exports
18.6
% of manufactured exports · 2024
▲ +3.6 vs 2023 · better
- India
- World
Source: World Bank, World Development Indicators (UN Comtrade) · Checked 28 Oct 2026, 11:15 PM IST
3. Defence: spending, imports and people
| Country | Military spending | % of GDP | Arms imports (SIPRI TIV) | Arms exports (SIPRI TIV) | Armed forces personnel |
|---|---|---|---|---|---|
| India | $92.1 bn (2025) | 2.30 (2025) | 2.86 bn (2025) | 81 mn (2025) | 3.07 mn (2020) |
| China | $335.5 bn (2025) | 1.72 (2025) | 207 mn (2025) | 880 mn (2025) | 2.54 mn (2020) |
| United States | $954.4 bn (2025) | 3.12 (2025) | 745 mn (2025) | 13.98 bn (2025) | 1.40 mn (2020) |
| European Union | $460.6 bn (2025) | 2.18 (2025) | 9.52 bn (2025) | 8.90 bn (2025) | 1.91 mn (2020) |
| Japan | $62.2 bn (2025) | 1.41 (2025) | 1.72 bn (2025) | 28 mn (2025) | 2,61,000 (2020) |
| Russia | $190.4 bn (2025) | 7.50 (2025) | 129 mn (2025) | 1.94 bn (2025) | 1.45 mn (2020) |
| South Korea | $47.8 bn (2025) | 2.60 (2025) | 222 mn (2025) | 2.02 bn (2025) | 5,69,000 (2020) |
| United Kingdom | $89.0 bn (2025) | 2.35 (2025) | 609 mn (2025) | 702 mn (2025) | 1,53,000 (2020) |
| World | $2.86 trn (2025) | 2.48 (2025) | 33.33 bn (2025) | 33.54 bn (2025) | 27.41 mn (2020) |
SIPRI’s trend-indicator value (TIV) measures the volume of major weapons transferred, not their price — use it to compare countries and years, not as money.
- India’s arms imports (2.86 bn TIV in 2025) are about 35.3 times its arms exports (81 mn). The government’s own releases below show the push to build more at home.
- The US spent about 10.4 times what India did, and China about 3.6 times.
Chart · India in Data
Military spending
2.30
% of GDP · 2025
▲ +0.07 vs 2024
- India
- World
Source: World Bank, World Development Indicators (SIPRI) · Checked 28 Oct 2026, 11:15 PM IST
Chart · India in Data
Arms imports
2,86,30,00,000
SIPRI trend-indicator value (TIV) · 2025
▲ +1,26,00,00,000 vs 2024
- India
- World
Source: World Bank, World Development Indicators (SIPRI) · Checked 28 Oct 2026, 11:15 PM IST
4. What India is building now (official releases)
These are recent Government of India announcements. Each is a claim by the ministry concerned, linked to the original release.
AI, semiconductors and computing
- Indigenous AI Vision chip (Project VeerAI) — Technology Development Board agreement with BigEndian Semiconductors, Bengaluru, for ₹130 crore support from the RDI Fund to develop an indigenous AI Vision SoC. (PIB, 5 Oct 2026)
- National Supercomputing Mission — 40 supercomputers delivering 68 petaflops as of September 2026, with indigenous servers, software, cooling and networking. (PIB, 4 Oct 2026)
- 6G target — Ministry of Communications says India targets 10% of global 6G patents and standards. (PIB, 8 Oct 2026)
Quantum and secure communication
- First 5.56 km free-space quantum key distribution link — QNu Labs with BISAG-N and IIT Gandhinagar demonstrated India’s first free-space QKD link at 5.56 km (field trial 27–28 September). (PIB, 3 Oct 2026)
- Quantum-secure technology — ₹150 crore RDI support to QNu Labs for a ₹300 crore project to strengthen indigenous quantum-secure technology. (PIB, 16 Oct 2026)
Space
- Space economy — Valued at around $9 billion now, expected to reach $40–45 billion in seven to eight years, the minister said. (PIB, 17 Oct 2026)
- New-age space technologies — Reusable launch vehicles, electric, green and nuclear propulsion and in-orbit servicing; through SpaDeX India became the fourth country to achieve autonomous docking in orbit. (PIB, 28 Oct 2026)
- Green propulsion — ₹116 crore RDI support to Manastu Space, Navi Mumbai, for indigenous green propulsion technology. (PIB, 26 Oct 2026)
Defence and military technology
- DRDO High-Altitude Platform — Indigenous HAPS reached 21 km above sea level and stayed at 20 km for more than 30 minutes in a flight trial. (PIB, 6 Oct 2026)
- BrahMos fire-control systems for Navy ships — ₹661.50 crore contract with BrahMos Aerospace under Buy (Indian-IDDM), with at least 68% indigenous content. (PIB, 6 Oct 2026)
- GSAT-7C satellite and Varunastra torpedoes — Contracts worth about ₹4,106 crore, including ₹2,563 crore for the indigenously built GSAT-7C communication satellite for the Air Force. (PIB, 15 Oct 2026)
- Submarine Air Independent Propulsion — DRDO’s indigenous AIP energy module, which extends diesel-electric submarines’ underwater endurance, entered Setting to Work Phase-2. (PIB, 24 Oct 2026)
- Fleet Support Ship ‘Surya’ — First indigenous Fleet Support Ship (FSS-1) launched at Hindustan Shipyard, Visakhapatnam. (PIB, 6 Oct 2026)
- INS Mangrol — Third Mahe-class anti-submarine warfare shallow water craft commissioned in Mumbai. (PIB, 12 Oct 2026)
- INS Samarthak — First of the indigenous Multi-Purpose Vessels commissioned into the Navy. (PIB, 16 Oct 2026)
Biotech, medicine and clean energy
- AI-driven drug discovery — ₹86 crore RDI support to Peptris Technologies, Bengaluru, for AI-driven drug discovery and development. (PIB, 12 Oct 2026)
- Indigenous 32-slice CT scanner — TDB support to Panacea Medical Technologies, Malur, to develop and commercialise an indigenous 32-slice CT scanner. (PIB, 15 Oct 2026)
- Green hydrogen — National Green Hydrogen Mission supports domestic manufacturing, production, demand and certification for fertiliser, refining, steel and transport. (PIB, 28 Oct 2026)
5. India’s youth today
| Country | Youth unemployment (15–24), % | Youth NEET, % | Tertiary enrolment, % gross | Internet users, % |
|---|---|---|---|---|
| India | 16.0 (2025) | 25.6 (2025) | 34.4 (2025) | 70.0 (2025) |
| China | 15.8 (2025) | — | 76.9 (2024) | 91.6 (2025) |
| United States | 9.3 (2025) | 11.6 (2025) | 79.4 (2022) | 94.7 (2024) |
| European Union | 16.2 (2025) | 9.4 (2025) | 79.5 (2024) | — |
| Japan | 3.9 (2025) | 3.1 (2019) | 64.5 (2023) | 85.5 (2024) |
| Russia | 7.6 (2025) | 6.7 (2025) | 60.4 (2024) | 94.4 (2024) |
| South Korea | 6.7 (2025) | — | 111.9 (2024) | 97.9 (2024) |
| United Kingdom | 14.6 (2025) | 14.4 (2025) | 80.4 (2023) | 95.5 (2024) |
| World | 13.4 (2025) | — | 43.6 (2024) | 73.6 (2025) |
- Higher education: India’s gross tertiary enrolment ratio is 34.4% (2025), against a world figure of 43.6%.
- Online: 70.0% of Indians use the internet (2025); world 73.6%.
- Not studying, not working: about one in 4 young Indians is NEET. This is the clearest gap between India’s huge young population and the skills the technologies above need.
Chart · India in Data
Youth unemployment (age 15–24)
16.0
% of young labour force · 2025
▲ +0.3 vs 2024 · worse
- India
- World
Source: World Bank, World Development Indicators (ILO modelled estimate) · Checked 28 Oct 2026, 11:15 PM IST
Chart · India in Data
Young people not in education, employment or training (NEET)
25.6
% of people aged 15–24 · 2025
▲ +1.4 vs 2024 · worse
Source: World Bank, World Development Indicators (ILO) · Checked 28 Oct 2026, 11:15 PM IST
6. The next 10 years: what the projections say
Projections from the World Bank’s Population Estimates and Projections (UN World Population Prospects based). They are projections, not forecasts of policy success.
| Country | Working-age (15–64) share, 2026 → 2036 | Aged 65+, 2026 → 2036 |
|---|---|---|
| India | 68.6% → 69.1% | 7.6% → 10.1% |
| China | 70.1% → 66.9% | 15.1% → 23.7% |
| United States | 64.3% → 62.4% | 18.8% → 21.7% |
| European Union | 63.1% → 60.2% | 22.9% → 27.2% |
| Japan | 58.8% → 56.7% | 30.2% → 33.2% |
| Russia | 64.9% → 65.8% | 18.4% → 20.6% |
| South Korea | 68.7% → 61.8% | 21.4% → 30.5% |
| United Kingdom | 63.3% → 62.4% | 19.9% → 22.7% |
| World | 65.3% → 65.0% | 10.6% → 13.4% |
- India’s population is projected to grow from 1.477 billion in 2026 to 1.588 billion in 2036.
- While China, Japan, South Korea and Europe age, India will still have a large and slightly growing working-age share. Whether this becomes an advantage depends on the numbers in sections 1 and 5 — research spending, researchers, enrolment and youth jobs. The data does not tell us how those will change; we will update this page as new figures come in.
What the data cannot tell you
- Missiles, bombs and weapon quality: there is no official, comparable international dataset ranking countries’ missiles or weapon systems. We report spending, arms trade and personnel only — not claims about who is “stronger”.
- AI and software: there is no official cross-country ranking of AI capability from a government or UN body comparable to the figures above. We list India’s official AI and semiconductor projects instead.
- Biotech and medicine: research spending, researchers, patents and high-tech exports (which include pharmaceuticals) are the comparable measures; we do not rank countries’ medical science beyond them.
Sources: World Bank, World Development Indicators — GB.XPD.RSDV.GD.ZS, SP.POP.SCIE.RD.P6, IP.PAT.RESD, IP.JRN.ARTC.SC, TX.VAL.TECH.CD, TX.VAL.TECH.MF.ZS, MS.MIL.XPND.CD, MS.MIL.XPND.GD.ZS, MS.MIL.MPRT.KD, MS.MIL.XPRT.KD, MS.MIL.TOTL.P1, SL.UEM.1524.ZS, SL.UEM.NEET.ZS, SE.TER.ENRR, IT.NET.USER.ZS; Population Estimates and Projections (source 40) — SP.POP.1564.TO.ZS, SP.POP.65UP.TO.ZS, SP.POP.TOTL; Press Information Bureau releases linked above. “#x of y” compares only the countries in these tables (the EU and World aggregates excluded); it is not a world ranking.
How we verified this
VerifiedAll comparison figures fetched from the World Bank API on 28 October 2026 (WDI and Population Estimates and Projections, latest year per country shown); every “what India is building” item is quoted from the linked PIB release; ratios and ranks computed by BDT among the listed countries only.
Sources
- 1.World Development Indicators (R&D, researchers, patents, articles, high-tech exports, military, youth) — World Bank (UNESCO, WIPO, SIPRI, ILO, ITU)
- 2.Population Estimates and Projections — World Bank (UN World Population Prospects)
- 3.Press releases on technology and defence — Press Information Bureau, Government of India