Key points
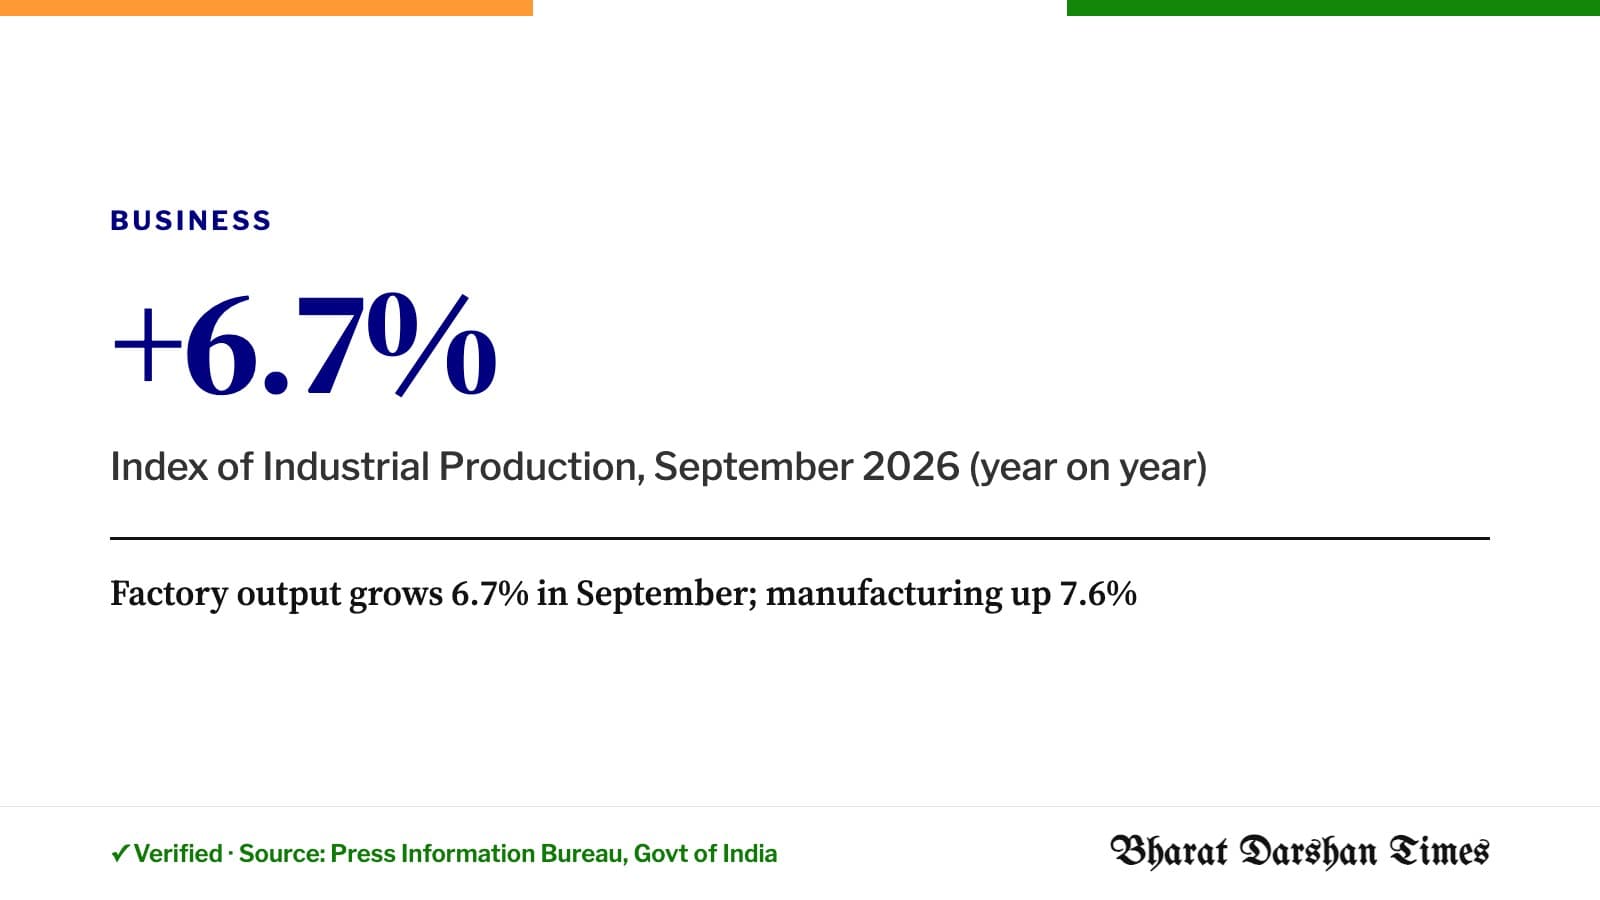
- India's Index of industrial production records growth of 6.7% in September 2026
In September 2026, Index of Industrial Production recorded a 6.7 % year-on-year growth, supported by 7.6 % growth in Manufacturing sector and strong growth of 11.2 % in Electricity & Gas Supply sector.
The Quick Estimate of Index of Industrial Production (IIP) is released on 28th of every month (or next working day if 28th is a holiday). The index is compiled with data received from source agencies, which in turn receive the data from the producing factories/ establishments. These Quick Estimates will undergo revision in subsequent releases as per the revision policy of IIP.
2. Key Highlights:
The IIP growth rate for the month of September 2026 is 6.7 percent which was 8.0 percent (Quick Estimate) in the month of August 2026.
The growth rates of the sectors, Mining & Quarrying, Manufacturing, Electricity & Gas Supply and Water Supply, Sewerage & Waste Management for the month of August 2026 are (-) 6.2 percent, 7.6 percent, 11.2 percent and 5.8 percent respectively.
The Quick Estimate of IIP stands at 124.3 against 116.5 in September 2025. The indices of Industrial Production for Mining & Quarrying, Manufacturing, Electricity & Gas Supply and Water Supply, Sewerage & Waste Management for the month of September 2026 stand at 90.4, 128.0, 128.6 and 146.4 respectively.
Within the Manufacturing sector, 17 out of 23 industry groups at NIC 2 digit-level have recorded a positive growth in September 2026 over September 2025. The top three positive contributors for the month of September 2026 are – “Manufacture of motor vehicles, trailers and semi-trailers” (19.0 %), “Manufacture of electrical equipment” (33.9 %), and “Manufacture of rubber and plastics products” (19.9 %).
In the industry group “Manufacture of motor vehicles, trailers and semi-trailers” item groups “Auto Components, Spares and Accessories”, “Passenger Cars”, and “Commercial Vehicles” have shown significant contribution in growth.
In the industry group “Manufacture of electrical equipment”, item groups “Electrical Apparatus for Switching or Protecting Electrical Circuits (e.g., Switchgear, Circuit Breakers/Switches, Control/Meter Panels) and Parts Thereof”, “UPS and Solid-State Drives” and “End-Face Connectors for Optical Fibres and Cables” have shown significant contribution in growth.
In the industry group “Manufacture of rubber and plastics products”, item groups “Acrylic Sheets (Including PVC, Polystyrene/Polycarbonate and Other Plastic Sheets)”, “Tyres for Light Motor Vehicles (LMV)”, and “V-Belts and Rubber Conveyors” have shown significant contribution in growth.
As per the Use-Based Classification, the indices stand at 111.6 for Primary Goods, 153.4 for Capital Goods, 131.7 for Intermediate Goods and 133.0 for Infrastructure/ Construction Goods for the month of September 2026. Further, the indices for Consumer durables and Consumer non-durables stand at 133.1 and 111.8 respectively.
The corresponding growth rates of IIP as per Use-Based Classification in September 2026 over September 2025 are 4.0 percent in Primary Goods, 10.4 percent in Capital Goods, 12.2 percent in Intermediate Goods, 7.2 percent in Infrastructure/ Construction Goods, 6.0 percent in Consumer durables and 1.4 percent in Consumer non-durables (Statement III). Based on Use-Based Classification, top three positive contributors to the growth of IIP for the month of September 2026 are Intermediate Goods, Primary Goods and Capital Goods.
Along with the Quick Estimate of IIP for the month of September 2026, the indices for August 2026 have undergone final revision in the light of the updated data received from the source agencies.
The Quick Estimates for September 2026 and the final revision for August 2026 have been compiled at weighted response rates of 86.5 percent and 92.0 percent respectively.
Details of Quick Estimates of the Index of Industrial Production for the month of September 2026 at Sector, Sub-Sector, 2-digit level of National Industrial Classification (NIC-2025), by Use-Based Classification and are given at Statements I, II (A, B, C, D) and III respectively. Also, for users to appreciate the changes in the industrial sector, Statement IV provides month-wise indices for the last 13 months, by industry groups (as per 2-digit level of NIC-2025), sectors and Sub-Sectors.
Release of the IIP for October 2026 will be on Monday, 30th November 2026.
Note: -
This Press Release (English and Hindi Version) is also available at the Ministry’s Website -http://www.mospi.gov.in.
Detailed data pertaining to IIP is available at https://esankhyiki.mospi.gov.in/macroindicators?product=iip
| STATEMENT I: INDEX OF INDUSTRIAL PRODUCTION – SECTORAL | ||||||||||
|---|---|---|---|---|---|---|---|---|---|---|
| (Base: 2022-23=100) | ||||||||||
| Months | Mining & Quarrying | Manufacturing | Electricity & Gas Supply | Water Supply, Sewerage & Waste Management | General | |||||
| 11.053 | 76.062 | 10.865 | 2.020 | 100.00 | ||||||
| 2025-26 | 2026-27 | 2025-26 | 2026-27 | 2025-26 | 2026-27 | 2025-26 | 2026-27 | 2025-26 | 2026-27 | |
| Apr | 110.3 | 106.1 | 111.9 | 118.7 | 116.3 | 121.7 | 137.1 | 146.1 | 112.7 | 118.2 |
| May | 114.7 | 113.1 | 116.2 | 122.2 | 117.9 | 130.1 | 137.6 | 145.1 | 116.7 | 122.5 |
| Jun | 108.9 | 110.6 | 114.4 | 125.3 | 118.4 | 131.8 | 137.3 | 145.7 | 114.7 | 124.8 |
| Jul | 95.3 | 94.4 | 118.7 | 128.4 | 122.8 | 133.5 | 138.2 | 148.4 | 117 | 125.6 |
| Aug | 90.8 | 86.6 | 116.2 | 126.2 | 119.2 | 133.9 | 138.8 | 147.6 | 114.2 | 123.1 |
| Sep* | 96.4 | 90.4 | 119 | 128 | 115.6 | 128.6 | 138.4 | 146.4 | 116.5 | 124.3 |
| Oct | 105.9 | 112.5 | 105.6 | 141.2 | 111.6 | |||||
| Nov | 106.9 | 117.3 | 98.7 | 140.5 | 114.6 | |||||
| Dec | 117.8 | 125.6 | 111.1 | 141.3 | 123.5 | |||||
| Jan | 120.6 | 124 | 115 | 142.7 | 123 | |||||
| Feb | 114.7 | 119.2 | 107 | 143.4 | 117.9 | |||||
| Mar | 125.4 | 131.4 | 119.2 | 146.3 | 129.7 | |||||
| Cumulative Index | ||||||||||
| Apr-Sep | 102.7 | 100.2 | 116.1 | 124.8 | 118.4 | 129.9 | 137.9 | 146.6 | 115.3 | 123.1 |
| Growth over the corresponding period of previous year | ||||||||||
| Aug | 15.8 | -4.6 | 3.6 | 8.6 | 3.7 | 12.3 | 6.9 | 6.3 | 4.7 | 7.8 |
| Sep* | 15.7 | -6.2 | 5.5 | 7.6 | 3.3 | 11.2 | 6.2 | 5.8 | 6.1 | 6.7 |
| Apr-Sep | 8 | -2.4 | 4.4 | 7.5 | 0.6 | 9.7 | 7.6 | 6.3 | 4.4 | 6.8 |
| *Figures for Sep 2026 are Quick Estimates.NOTE : Indices for the months of Aug'26 incorporate updated production data. | *Figures for Sep 2026 are Quick Estimates. | NOTE : Indices for the months of Aug'26 incorporate updated production data. | ||||||||
| *Figures for Sep 2026 are Quick Estimates. | ||||||||||
| NOTE : Indices for the months of Aug'26 incorporate updated production data. |
| STATEMENT II A: INDEX OF INDUSTRIAL PRODUCTION - (Manufacturing at NIC 2 digit) | ||||||||
|---|---|---|---|---|---|---|---|---|
| (Base: 2022-23=100) | ||||||||
| NIC 2025 | Description | Weights | Index | Cumulative Index | Percentage Growth | |||
| Sep'25 | Sep'26* | Apr-Sep | Sep'26* | Apr-Sep | ||||
| 2025-26 | 2026-27 | 2026-27 | ||||||
| 10 | Manufacture of food products | 5.679 | 97.5 | 105.1 | 98.3 | 103.6 | 7.8 | 5.4 |
| 11 | Manufacture of beverages | 1.113 | 92.4 | 128.8 | 126.3 | 142.4 | 39.4 | 12.7 |
| 12 | Manufacture of tobacco products | 0.774 | 116.1 | 119.1 | 118.8 | 114.9 | 2.6 | -3.3 |
| 13 | Manufacture of textiles | 3.275 | 123.7 | 145.2 | 122.1 | 137.9 | 17.4 | 12.9 |
| 14 | Manufacture of wearing apparel | 1.970 | 94 | 89.1 | 98.4 | 92.9 | -5.2 | -5.6 |
| 15 | Manufacture of leather and related products | 0.607 | 98.3 | 102.7 | 103.2 | 105.8 | 4.5 | 2.5 |
| 16 | Manufacture of wood and products of wood and cork, except furniture; manufacture of articles of straw and plaiting materials | 0.239 | 116.6 | 104.3 | 104.9 | 102.2 | -10.5 | -2.6 |
| 17 | Manufacture of paper and paper products | 1.375 | 107.1 | 110.2 | 107 | 115.2 | 2.9 | 7.7 |
| 18 | Printing and reproduction of recorded media | 0.506 | 99.5 | 94.4 | 99.4 | 98.3 | -5.1 | -1.1 |
| 19 | Manufacture of coke and refined petroleum products | 7.721 | 102.1 | 107.9 | 108 | 108.4 | 5.7 | 0.4 |
| 20 | Manufacture of chemicals and chemical products | 7.813 | 108.8 | 108.2 | 109.2 | 108.0 | -0.6 | -1.1 |
| 21 | Manufacture of basic pharmaceuticals products and pharmaceutical preparations | 5.833 | 123.9 | 112.9 | 121.7 | 116.3 | -8.9 | -4.4 |
| 22 | Manufacture of rubber and plastics products | 3.384 | 106.8 | 128.1 | 104.9 | 124.3 | 19.9 | 18.5 |
| 23 | Manufacture of other non-metallic mineral products | 3.519 | 107.5 | 114.9 | 111.6 | 122.2 | 6.9 | 9.5 |
| 24 | Manufacture of basic metals | 9.198 | 129.4 | 133.4 | 128 | 132.7 | 3.1 | 3.7 |
| 25 | Manufacture of fabricated metal products, except machinery and equipment | 2.481 | 128.8 | 141.9 | 120.4 | 134.1 | 10.2 | 11.4 |
| 26 | Manufacture of computer, electronic and optical products | 2.085 | 163.3 | 175.3 | 140.8 | 158.5 | 7.3 | 12.6 |
| 27 | Manufacture of electrical equipment | 3.175 | 129 | 172.7 | 129.7 | 167.9 | 33.9 | 29.5 |
| 28 | Manufacture of machinery and equipment n.e.c. | 5.020 | 139.7 | 144.0 | 118.4 | 129.0 | 3.1 | 9.0 |
| 29 | Manufacture of motor vehicles, trailers and semi-trailers | 6.417 | 123.6 | 147.1 | 116.4 | 138.7 | 19 | 19.2 |
| 30 | Manufacture of other transport equipment | 2.089 | 160.5 | 191.2 | 139.3 | 170.0 | 19.1 | 22.0 |
| 31 | Manufacture of furniture | 0.283 | 123.4 | 139.2 | 114.5 | 124.3 | 12.8 | 8.6 |
| 32 | Other manufacturing | 1.509 | 135 | 126.4 | 112 | 114.1 | -6.4 | 1.9 |
| 10-32 | Manufacturing | 76.062 | 119 | 128.0 | 116.1 | 124.8 | 7.6 | 7.5 |
| *Figures for Sep 2026 are Quick Estimates. |
| STATEMENT II-B: INDEX OF INDUSTRIAL PRODUCTION - (Mining & Quarrying) | ||||||||
|---|---|---|---|---|---|---|---|---|
| (Base: 2022-23=100) | ||||||||
| NIC 2025 | Description | Weights | Index | Cumulative Index | Percentage growth | |||
| Sep'25 | Sep'26* | Apr-Sep | Sep'26* | Apr-Sep | ||||
| 2025-26 | 2026-27 | 2026-27 | ||||||
| 05-06 | Fuel Minerals | 5.647 | 93.6 | 95.6 | 99.3 | 96.3 | 2.1 | -3 |
| 07 | Metallic Minerals incl. Rare Earth Minerals | 1.995 | 91.2 | 104 | 100.5 | 119.6 | 14 | 19 |
| 08 | Non-Metallic Minerals incl. Minor Mineral | 3.411 | 104.1 | 73.7 | 109.8 | 95.4 | -29.2 | -13.1 |
| 05-08 | Mining & Quarrying | 11.053 | 96.4 | 90.4 | 102.7 | 100.2 | -6.2 | -2.4 |
| STATEMENT II-C: INDEX OF INDUSTRIAL PRODUCTION - (Electricity & Gas Supply) | ||||||||
| (Base: 2022-23=100) | ||||||||
| NIC 2025 | Description | Weights | Index | Cumulative Index | Percentage Growth | |||
| Sep'25 | Sep'26* | Apr-Sep | Sep'26* | Apr-Sep | ||||
| 2025-26 | 2026-27 | 2026-27 | ||||||
| 3512 | Electricity Generation from Renewable Sources | 2.332 | 160.8 | 167.7 | 150.6 | 166.4 | 4.3 | 10.5 |
| 3511 | Electricity Generation from Non-Renewable Sources | 7.839 | 101.6 | 118.4 | 109 | 120.5 | 16.5 | 10.6 |
| 351 | Electricity | 10.171 | 115.2 | 129.7 | 118.5 | 131 | 12.6 | 10.5 |
| 352 | Gas Supply | 0.694 | 121.2 | 113.1 | 116 | 114.5 | -6.7 | -1.3 |
| 35 | Electricity & Gas Supply | 10.865 | 115.6 | 128.6 | 118.4 | 129.9 | 11.2 | 9.7 |
| STATEMENT II-D: INDEX OF INDUSTRIAL PRODUCTION - Water Supply, Sewerage & Waste Management | ||||||||
| (Base: 2022-23=100) | ||||||||
| NIC 2025 | Description | Weights | Index | Cumulative Index | Percentage Growth | |||
| Sep'25 | Sep'26* | Apr-Sep | Sep'26* | Apr-Sep | ||||
| 2025-26 | 2026-27 | 2026-27 | ||||||
| 36 | Water Supply | 1.059 | 152 | 158.6 | 150.9 | 157.5 | 4.3 | 4.4 |
The release continues with detailed annex tables; see the full statement at the source link below.
This report is based on the official release by the Ministry of Statistics & Programme Implementation, issued through the Press Information Bureau, Government of India (28 OCT 2026 4:00PM by PIB Delhi). Read the original: Quick Estimates of Index of Industrial Production and Use- Based Index for the Month of September 2026 (Base 2022-23=100).
How we verified this
VerifiedEvery fact, figure and quotation is taken from the official PIB release (Release ID 2329475) issued by the Ministry of Statistics & Programme Implementation on 28 OCT 2026 4:00PM by PIB Delhi; checked against the source on 28 Oct 2026. Headline and summary written by BDT from that release.
Sources
- 1.Quick Estimates of Index of Industrial Production and Use- Based Index for the Month of September 2026 (Base 2022-23=100) — Press Information Bureau, Government of India