BreakingBusinessVerified
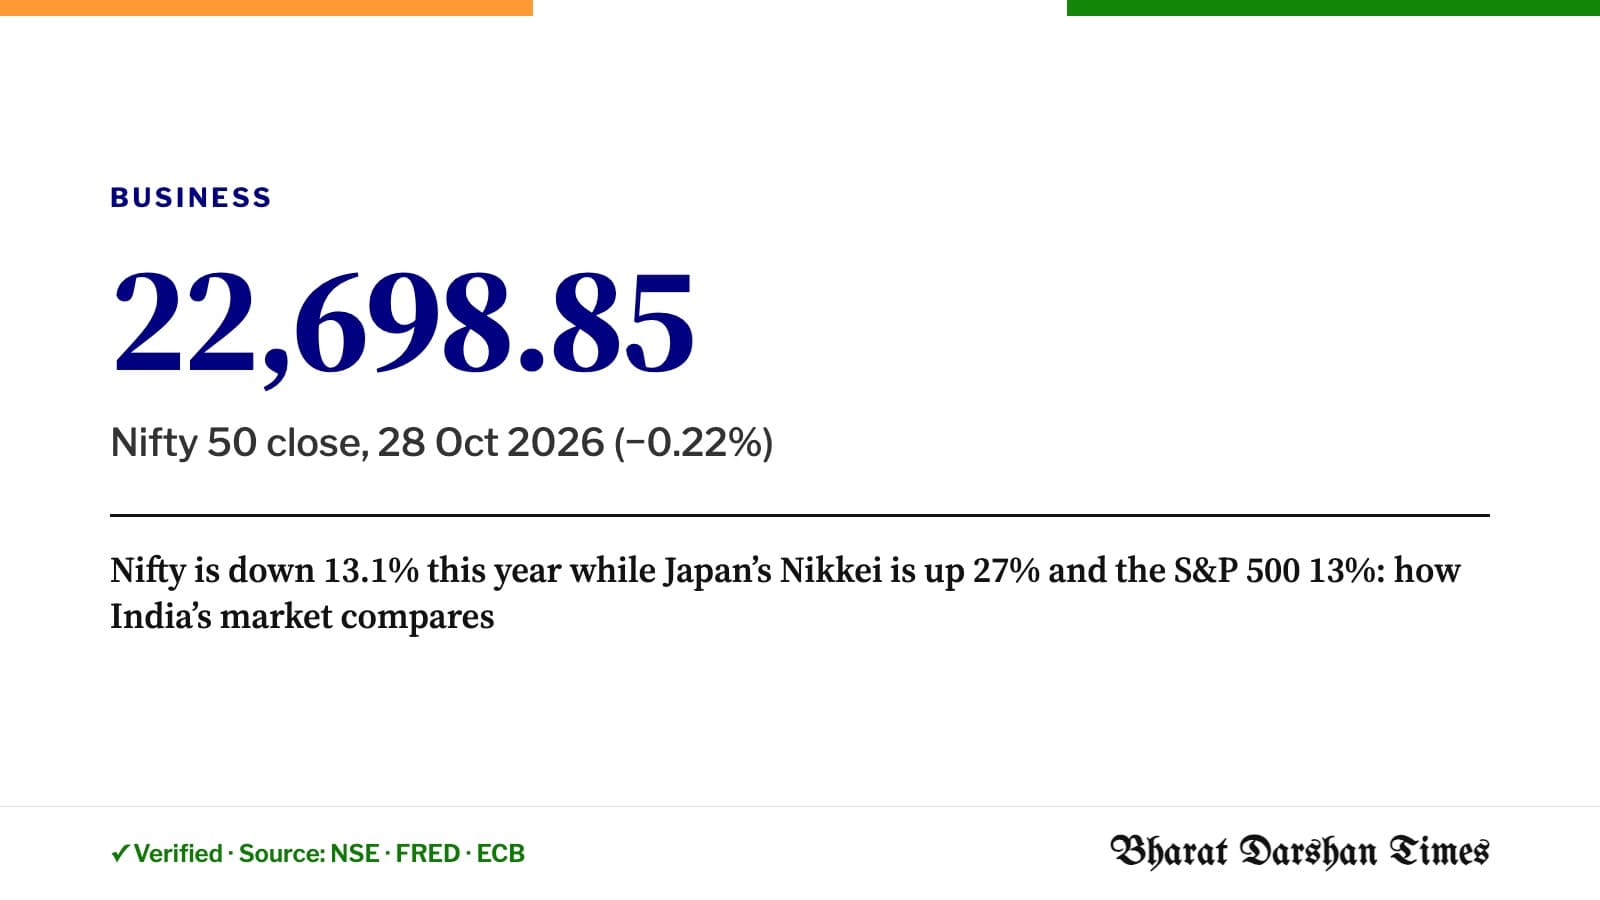
Nifty is down 13.1% this year while Japan’s Nikkei is up 27% and the S&P 500 13%: how India’s market compares
The Nifty 50 closed at 22,698.85 on 28 October, −0.22% on the day; IT stocks fell 1.98% while banks rose 0.54%. All figures from NSE, FRED and the ECB.
Market close, Wednesday 28 October 2026 (NSE official index file)
- Nifty 50: 22,698.85, down 50.90 points (−0.22%). Day’s range 22,497.70–22,778.05; P/E 18.99.
- Nifty Bank: 54,267.40 (+0.54%) · Nifty IT: 31,553.40 (−1.98%)
- Midcap 100: 57,274.70 (+0.43%) · Smallcap 100: 18,634.90 (+0.90%)
- India VIX (expected volatility): 16.25 (−0.96%)
- Rupee: 95.22 per US dollar on 28 Oct 2026 (ECB reference rates), against 89.87 at the end of 2025 — the rupee is 6.0% weaker against the dollar this year.
Sectors today
| Index | Close | Change |
|---|---|---|
| Nifty Auto | 25,707.35 | +1.45% |
| Nifty Consumer Durables | 34,738.60 | +1.41% |
| Nifty Media | 1,637.40 | +1.38% |
| Nifty Healthcare Index | 16,100.10 | +1.15% |
| Nifty Pharma | 26,541.35 | +1.04% |
| NIFTY Smallcap 100 | 18,634.90 | +0.90% |
| Nifty Bank | 54,267.40 | +0.54% |
| Nifty Financial Services | 24,418.25 | +0.47% |
| NIFTY Midcap 100 | 57,274.70 | +0.43% |
| Nifty Private Bank | 26,722.10 | +0.35% |
| Nifty PSU Bank | 8,133.60 | +0.08% |
| Nifty Next 50 | 67,303.70 | −0.06% |
| Nifty Metal | 11,769.35 | −0.32% |
| Nifty FMCG | 42,878.35 | −0.56% |
| Nifty Realty | 797.85 | −0.89% |
| Nifty Energy | 34,946.30 | −0.89% |
| Nifty IT | 31,553.40 | −1.98% |
| Nifty Oil & Gas | 10,296.60 | −2.27% |
Best: Nifty Auto (+1.45%). Worst: Nifty Oil & Gas (−2.27%).
India vs the world’s big markets
| Index | Latest close | Date | 1 day | Since 30 Sep | Since 31 Dec 2025 |
|---|---|---|---|---|---|
| Nifty 50 (India) | 22,698.85 | 28 Oct 2026 | −0.22% | +0.35% | −13.13% |
| S&P 500 (US) | 7,722.60 | 27 Oct 2026 | +0.60% | +0.93% | +12.81% |
| Dow Jones (US) | 52,377.57 | 27 Oct 2026 | +0.03% | +2.89% | +8.98% |
| Nasdaq Composite (US) | 26,477.81 | 27 Oct 2026 | +1.18% | −1.43% | +13.92% |
| Nikkei 225 (Japan) | 63,954.19 | 28 Oct 2026 | +1.08% | −4.19% | +27.05% |
US markets were still trading when this was published, so their latest available close is 27 October. Year-to-date changes are measured from each index’s last close of 2025 (Nikkei: 30 December 2025). Index values are in local currency; returns for a dollar investor would also depend on exchange rates.
What the numbers show: Indian shares have lagged the large markets in the United States and Japan in 2026. The Nifty 50 is 13.1% below its end-2025 level, while the Nikkei 225 is up 27.0% and the S&P 500 is up 12.8%. The Nifty’s price-to-earnings ratio has fallen to 18.99 from 22.75 at the end of 2025, according to NSE data.
Rupee against the dollar
Chart · India in Data
Rupee per US dollar — daily
95.22
₹ per US$ · 28 Oct 2026
▲ +6.91 vs 28 Oct 2025
Source: European Central Bank · Checked 28 Oct 2026, 11:15 PM IST
Sources: NSE — daily index closing file, 28 Oct 2026; NSE files for 30 Sep 2026 and 31 Dec 2025; Federal Reserve Bank of St. Louis (FRED): S&P 500, Dow Jones, Nasdaq Composite, Nikkei 225; ECB euro reference rates. This is market data, not investment advice.
How we verified this
VerifiedEvery index value is taken from the NSE official daily index file (28 Oct 2026, 30 Sep 2026, 31 Dec 2025), FRED daily series for the S&P 500, Dow Jones, Nasdaq Composite and Nikkei 225, and ECB reference rates (INR/USD as a cross rate); changes computed by BDT from those values.
Sources
- 1.Daily index closing values, 28 Oct 2026 — National Stock Exchange of India
- 2.S&P 500, Dow Jones, Nasdaq Composite, Nikkei 225 daily closes — Federal Reserve Bank of St. Louis (FRED)
- 3.Euro foreign exchange reference rates (INR, USD) — European Central Bank