BusinessExplainerVerified
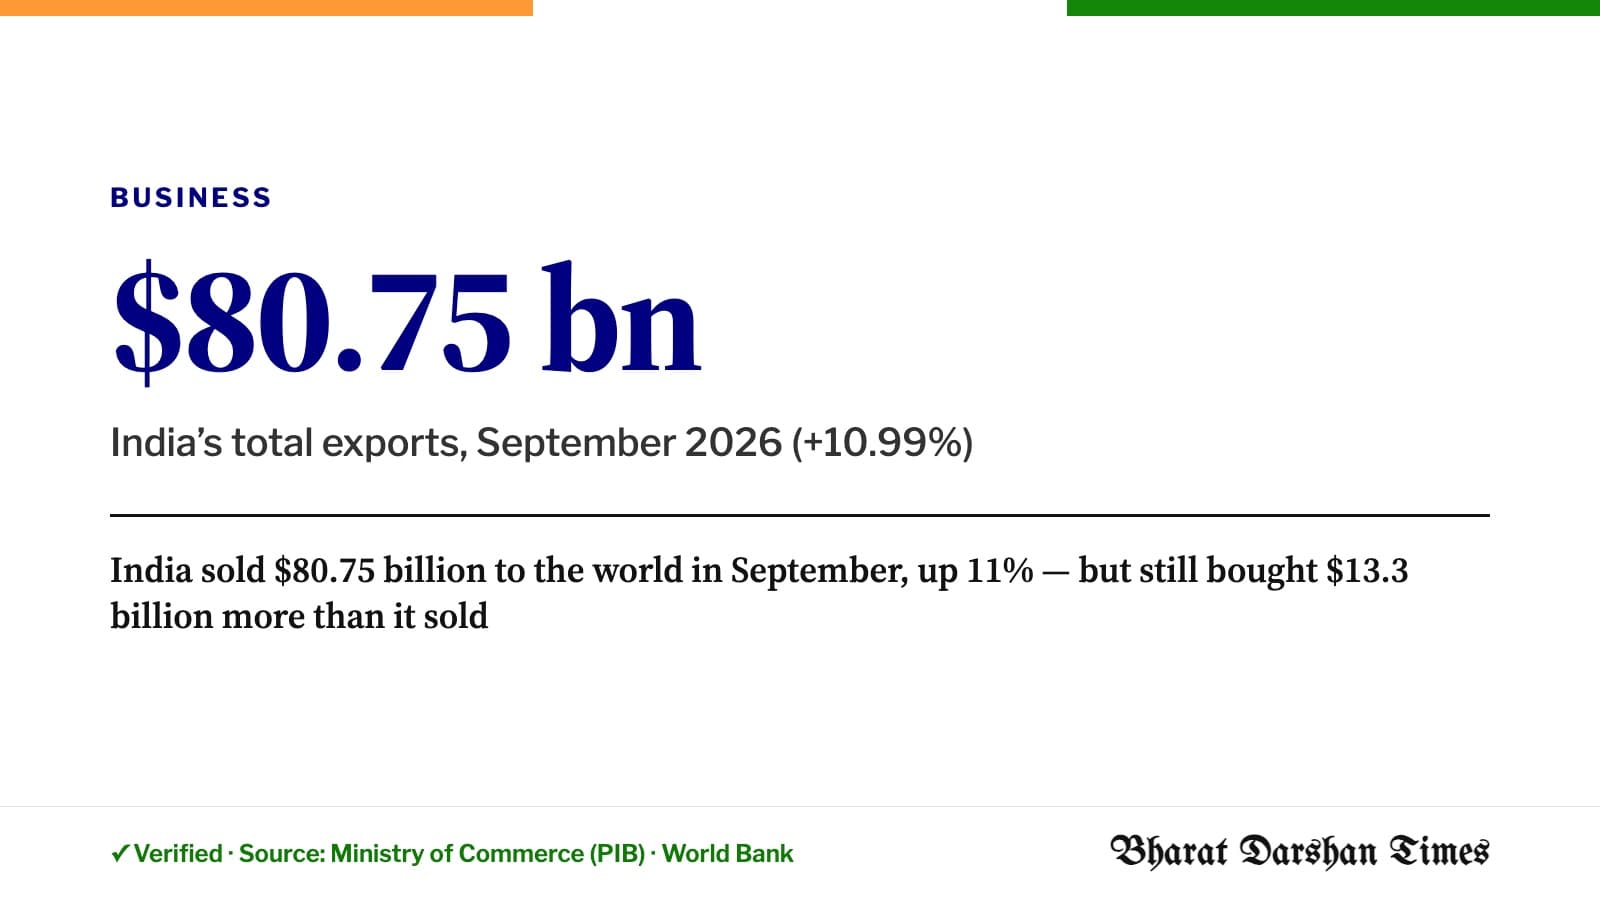
India sold $80.75 billion to the world in September, up 11% — but still bought $13.3 billion more than it sold
Merchandise exports jumped to $44.40 billion as electronics exports grew 70%; in a comparison of 10 large economies, India ranks 8th by exports, World Bank data show.
India’s latest official trade figures, released by the Ministry of Commerce and Industry on 15 October 2026, cover September 2026. The next monthly figures are due in mid-November.
September 2026 at a glance
| Sep 2026 (US$ bn) | Sep 2025 (US$ bn) | |
|---|---|---|
| Merchandise exports | 44.40 | 36.08 |
| Merchandise imports | 74.61 | 69.08 |
| Services exports* | 36.35 | 36.67 |
| Services imports* | 19.44 | 17.84 |
| Total exports | 80.75 | 72.76 |
| Total imports | 94.05 | 86.93 |
| Trade balance | −13.30 | −14.17 |
Services figures for September are estimates; RBI’s latest services data are for August 2026.
- Total exports grew 10.99% and total imports 8.19% over September 2025.
- The overall trade deficit narrowed to $13.30 billion from $14.17 billion.
First half of 2026-27 (April–September)
| Apr–Sep 2026-27 (US$ bn) | Apr–Sep 2025-26 (US$ bn) | |
|---|---|---|
| Total exports | 476.20 | 418.31 |
| Total imports | 551.13 | 476.42 |
| Trade balance | −74.93 | −58.10 |
| Merchandise trade deficit | −177.64 | −156.88 |
| Services trade surplus* | 102.71 | 98.77 |
Exports grew 13.84% in the first half, but imports grew faster (15.68%), so the overall deficit widened.
What India sells more of
Exports that grew in September 2026 over September 2025 include electronic goods (+70.44%), other cereals (+49.88%), handicrafts (+43.19%), meat, dairy and poultry (+35.18%), petroleum products (+31.9%), engineering goods (+20.91%), gems and jewellery (+18.95%), drugs and pharmaceuticals (+4.68%) and rice (+4.21%).
On the import side, gold imports fell 81.27% and silver imports 49.11% in September.
Where India stands among big trading nations
Exports and imports of goods and services, latest year available (World Bank, current US$):
| Rank | Economy | Exports (US$ bn) | Imports (US$ bn) | Year |
|---|---|---|---|---|
| 1 | China | 4108.5 | 3292.3 | 2025 |
| 2 | United States | 3215.4 | 4113.8 | 2024 |
| 3 | Germany | 2042.3 | 1923.3 | 2025 |
| 4 | United Kingdom | 1224.7 | 1275.2 | 2025 |
| 5 | France | 1124.1 | 1137.8 | 2025 |
| 6 | Netherlands | 1075.1 | 925.6 | 2025 |
| 7 | Japan | 921.0 | 958.4 | 2024 |
| 8 | India | 880.7 | 949.7 | 2025 |
| 9 | Korea, Rep. | 856.9 | 760.2 | 2025 |
| 10 | Italy | 822.3 | 773.0 | 2025 |
This compares 10 large economies chosen by BDT; it is not a full world ranking. World Bank figures are annual and use a different method from India’s monthly releases, so the two sets of numbers should not be added together.
Among these 10 economies, India ranks 8th by exports of goods and services. Like the United States, the United Kingdom, France and Japan, it imports more than it exports, while China, Germany, the Netherlands, South Korea and Italy export more than they import.
Sources: Ministry of Commerce and Industry via PIB — India’s foreign trade, September 2026 (15 Oct 2026); World Bank, World Development Indicators: exports and imports of goods and services.
How we verified this
VerifiedMonthly and April–September figures are taken from the Ministry of Commerce release of 15 Oct 2026 (PIB 2323944); the cross-country comparison uses World Bank WDI series NE.EXP.GNFS.CD and NE.IMP.GNFS.CD, latest year per country.
Sources
- 1.Cumulative exports April–September 2026-27 (India’s foreign trade, September 2026) — Ministry of Commerce and Industry (PIB)
- 2.Exports of goods and services (current US$) — World Bank
- 3.Imports of goods and services (current US$) — World Bank