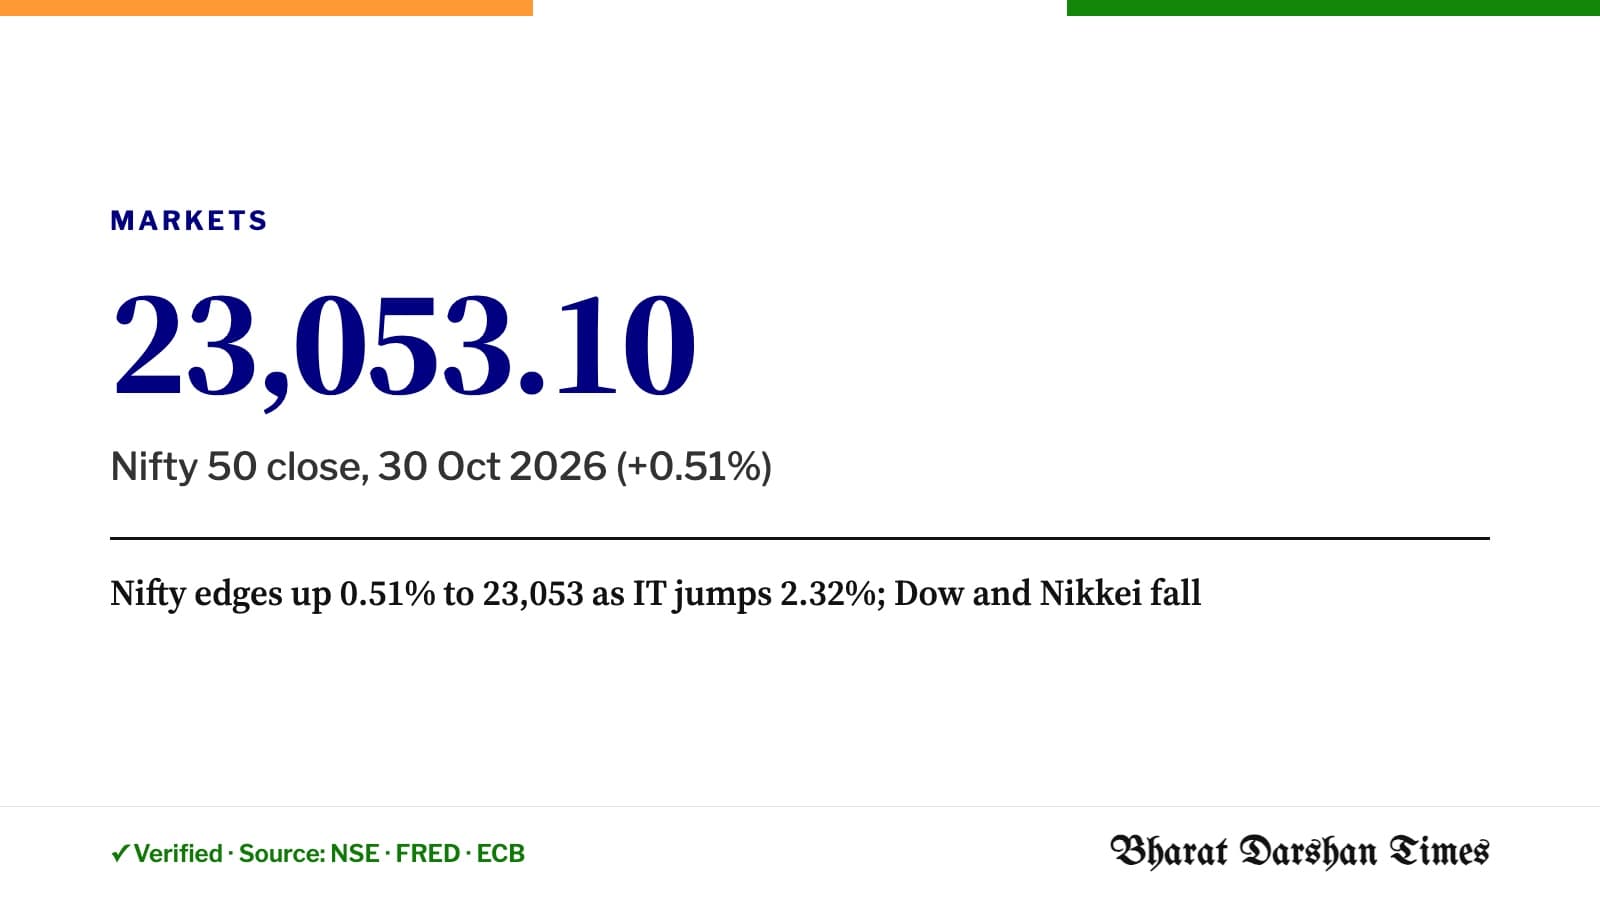
Market close, 30 Oct 2026 (NSE official index file)
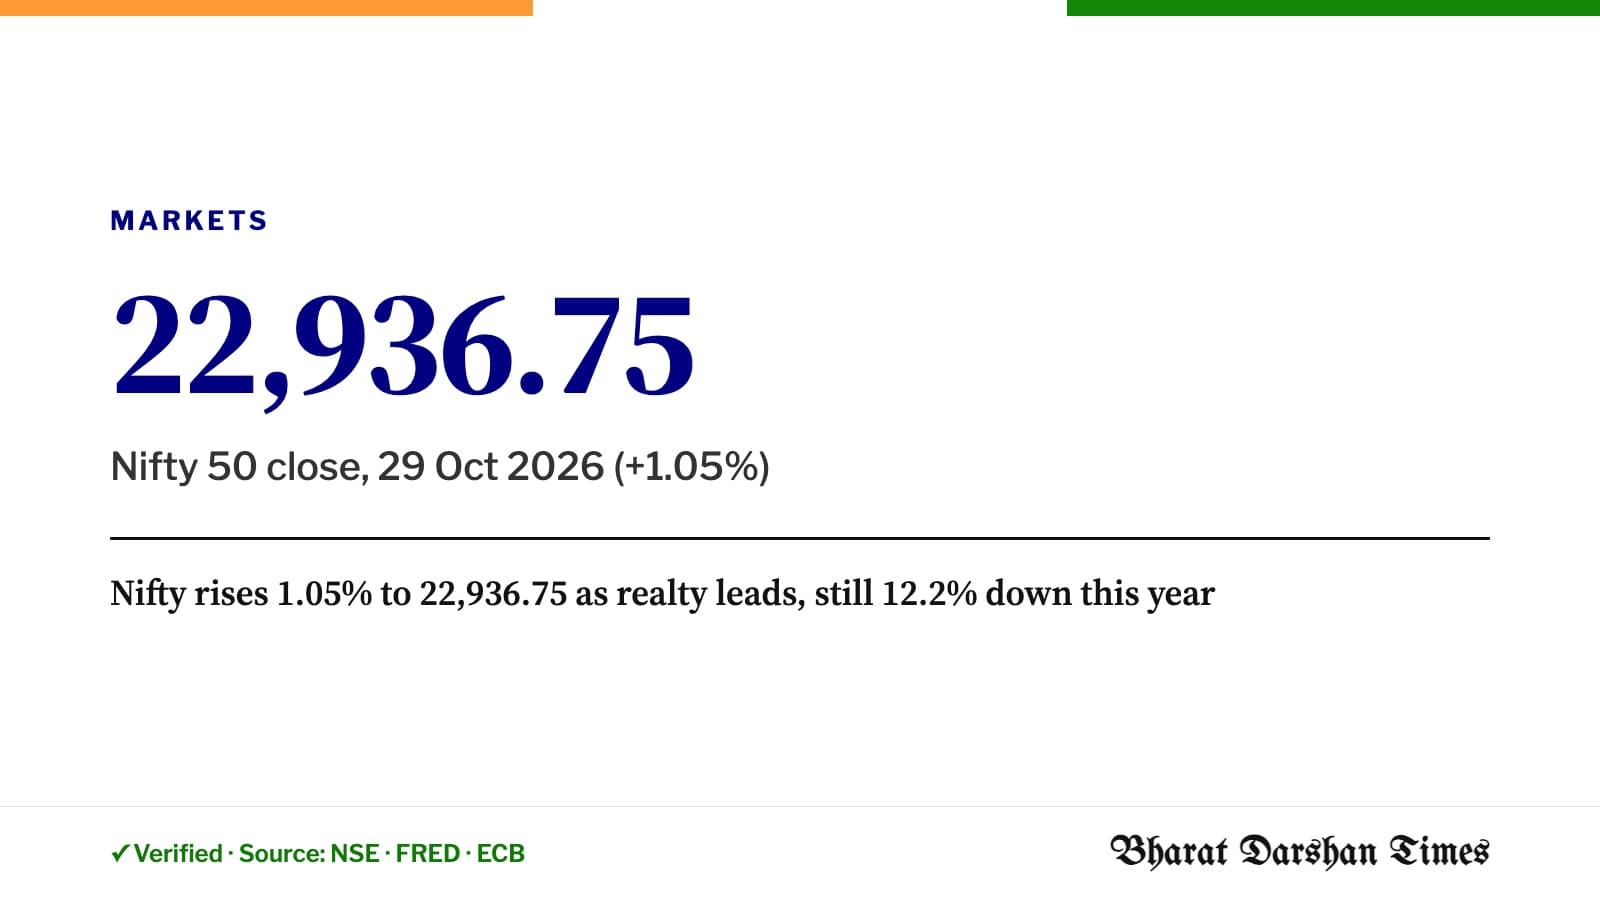
- Nifty 50: 23,053.10, up 116.35 points (+0.51%). Range 22,905.10–23,118.10; P/E 19.3.
- Nifty Bank: 54,686.95 (−0.41%) · Nifty IT: 32,606.90 (+2.32%)
- Midcap 100: 57,301.25 (−0.93%) · Smallcap 100: 18,463.60 (−1.85%)
- India VIX: 15.3 (+1.22%)
- Rupee: 94.96 per US dollar on 30 Oct 2026 (ECB reference rates), against 89.87 at the end of 2025.
Sectors today
| Index | Close | Change |
|---|---|---|
| Nifty IT | 32,606.90 | +2.32% |
| Nifty Healthcare Index | 16,449.55 | +1.58% |
| Nifty Pharma | 27,124.85 | +1.55% |
| Nifty Financial Services | 24,712.20 | +0.03% |
| Nifty Private Bank | 27,053.50 | +0.00% |
| Nifty Bank | 54,686.95 | −0.41% |
| Nifty Oil & Gas | 10,303.25 | −0.47% |
| Nifty Metal | 11,784.90 | −0.54% |
| Nifty Next 50 | 67,709.10 | −0.61% |
| Nifty FMCG | 43,609.20 | −0.62% |
| Nifty Realty | 813.90 | −0.72% |
| Nifty Auto | 25,422.70 | −0.87% |
| Nifty PSU Bank | 8,234.85 | −0.93% |
| NIFTY Midcap 100 | 57,301.25 | −0.93% |
| Nifty Energy | 34,957.90 | −0.97% |
| Nifty Media | 1,631.25 | −1.46% |
| Nifty Consumer Durables | 34,525.15 | −1.78% |
| NIFTY Smallcap 100 | 18,463.60 | −1.85% |
India vs the world’s big markets
| Index | Latest close | Date | 1 day | Since 30 Sept 2026 | Since 31 Dec 2025 |
|---|---|---|---|---|---|
| Nifty 50 (India) | 23,053.10 | 30 Oct 2026 | +0.51% | +1.91% | −11.77% |
| S&P 500 (US) | 7,743.98 | 28 Oct 2026 | +0.28% | +1.21% | +13.13% |
| Dow Jones (US) | 51,770.31 | 30 Oct 2026 | −1.09% | +1.70% | +7.71% |
| Nasdaq Composite (US) | 26,184.72 | 29 Oct 2026 | −1.38% | −2.52% | +12.66% |
| Nikkei 225 (Japan) | 63,290.11 | 30 Oct 2026 | −2.12% | −5.19% | +25.73% |
Each index’s latest available close is shown; US markets close after Indian evening, so their latest close may be the previous day. Values are in local currency.
Rupee against the dollar
Chart · India in Data
Rupee per US dollar — daily
94.96
₹ per US$ · 30 Oct 2026
▲ +6.24 vs 30 Oct 2025
Source: European Central Bank · Checked 1 Nov 2026, 6:30 AM IST
Sources: NSE daily index file, 30 Oct 2026; NSE files for 30 Sept 2026 and 31 Dec 2025; FRED: S&P 500, Dow Jones, Nasdaq Composite, Nikkei 225; ECB reference rates. Market data, not investment advice.
How we verified this
VerifiedIndex values from the NSE official daily files (2026-10-30, 2026-09-30, 2025-12-31), FRED daily series and ECB reference rates; all changes computed by BDT from those values.
Sources
- 1.Daily index closing values, 30 Oct 2026 — National Stock Exchange of India
- 2.S&P 500, Dow Jones, Nasdaq Composite, Nikkei 225 daily closes — Federal Reserve Bank of St. Louis (FRED)
- 3.Euro foreign exchange reference rates (INR, USD) — European Central Bank