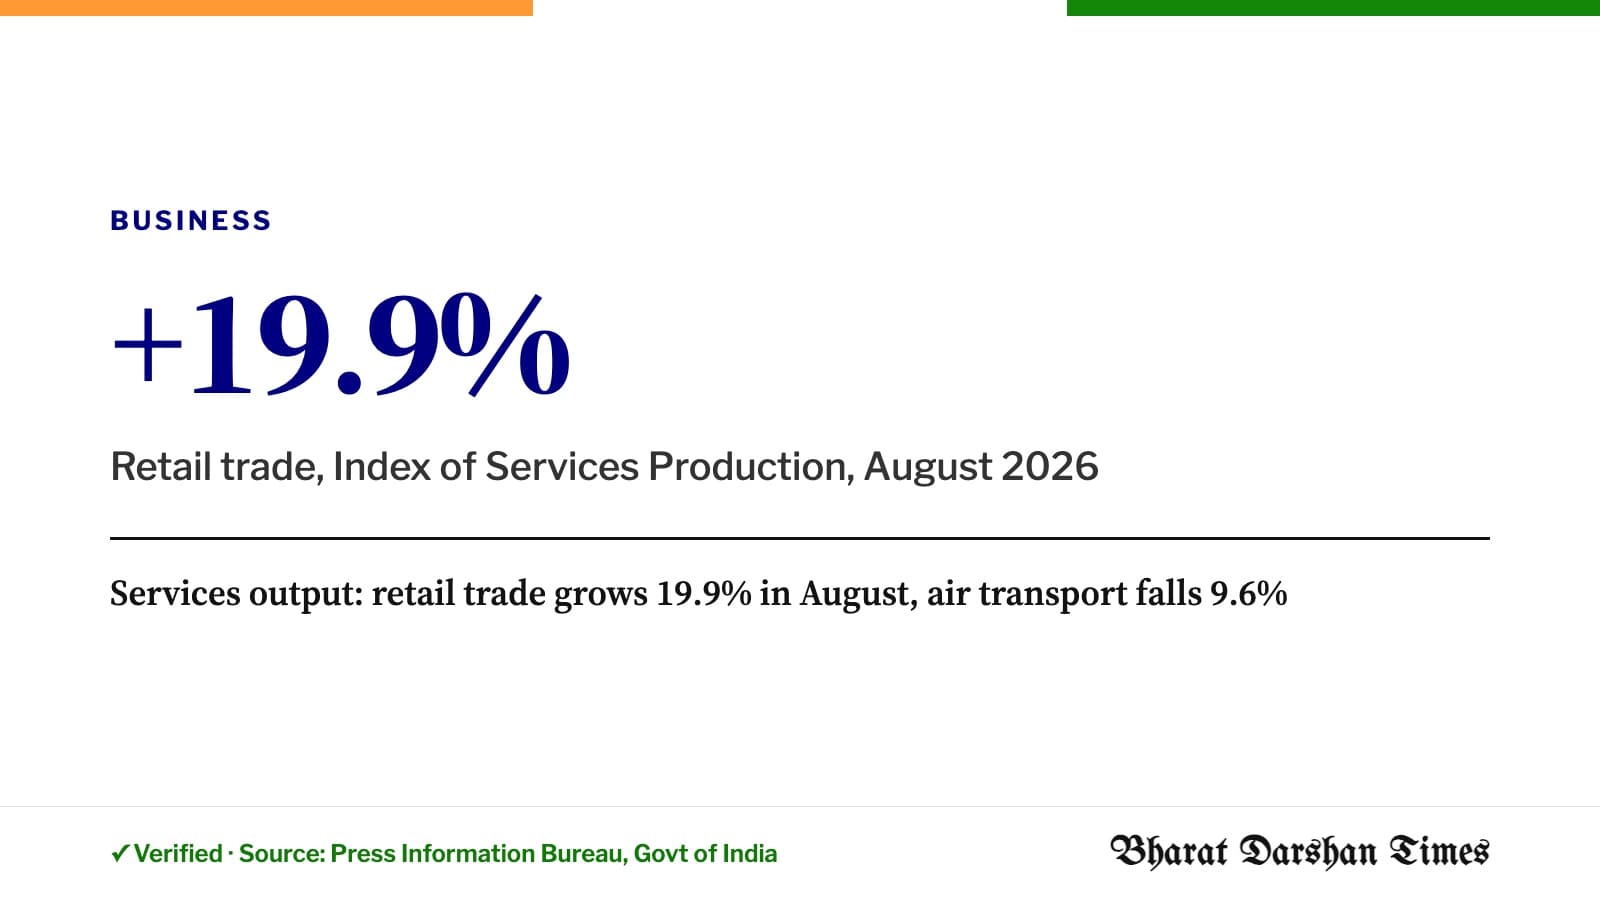
Retail trade grew 19.9% in August 2026 from a year earlier, the fastest of 19 service sub-sectors in a new experimental index, while air transport shrank 9.6%.
The Ministry of Statistics and Programme Implementation (MoSPI) released the Index of Services Production (ISP) for August on 29 October, with 2024-25 as the base year. Seventeen of the 19 sub-sectors grew over August 2025.
The numbers
| S. No. | Broad Sub -Sector | ISP August, 2026 | Growth in August, 2026 over August, 2025 |
|---|---|---|---|
| 1 | Wholesale Trade | 122.9 | 10.2 |
| 2 | Retail Trade | 139.2 | 19.9 |
| 3 | Repair Services | 130.7 | 17.6 |
| 4 | Accommodation and food | 145.3 | 11.9 |
| 5 | Railway Transport | 105.6 | 3.7 |
| 6 | Road Transport | 128.4 | 9.4 |
| 7 | Water Transport | 109.1 | 9.5 |
| 8 | Air Transport | 89.2 | -9.6 |
| 9 | Warehousing and support activities for transportation | 126.8 | 11.2 |
| 10 | Postal and Courier | 114.3 | 13.2 |
| 11 | Telecommunications | 120.7 | 11.8 |
| 12 | Information and Broadcasting | 98.6 | 7.2 |
| 13 | Banking | 125.0 | 14.9 |
| 14 | Insurance | 107.9 | 16.5 |
| 15 | Real Estate | 115.3 | 17.6 |
| 16 | IT and computer related services | 116.4 | 13.8 |
| 17 | Professional, scientific & technical services including R & D | 112.7 | 14.2 |
| 18 | Administrative and support services | 118.8 | 13.1 |
| 19 | Arts, Entertainment and Recreation Services | 111.7 | -4.7 |
| S. No. | Broad Sub -Sector | August’25 | September’25 | October’25 | November’25 | December’25 | January’26 | February’26 | March’26 | April’26 | May’26 | June’26 | July’26 | August’26 |
|---|---|---|---|---|---|---|---|---|---|---|---|---|---|---|
| 1 | Wholesale Trade | 111.5 | 133.9 | 136.7 | 117.5 | 127.8 | 143.6 | 132.1 | 142.0 | 119.9 | 118.0 | 122.8 | 126.8 | 122.9 |
| 2 | Retail Trade | 116.1 | 133.8 | 153.1 | 122.3 | 138.7 | 145.4 | 138.7 | 155.4 | 137.5 | 138.1 | 138.0 | 140.0 | 139.2 |
| 3 | Repair Services | 111.2 | 125.1 | 140.0 | 114.7 | 122.0 | 134.5 | 110.0 | 187.4 | 119.9 | 122.4 | 120.1 | 126.3 | 130.7 |
| 4 | Accommodation and food | 129.9 | 124.7 | 136.7 | 148.2 | 166.9 | 150.2 | 148.5 | 148.3 | 138.1 | 148.9 | 141.2 | 144.0 | 145.3 |
| 5 | Railway Transport | 101.9 | 97.5 | 99.6 | 100.9 | 105.7 | 107.5 | 99.9 | 112.4 | 99.6 | 107.3 | 105.5 | 106.1 | 105.6 |
| 6 | Road Transport | 117.4 | 130.5 | 115.4 | 116.8 | 130.8 | 128.9 | 124.9 | 153.1 | 110.3 | 125.9 | 131.6 | 132.1 | 128.4 |
| 7 | Water Transport | 99.7 | 98.9 | 102.0 | 108.0 | 111.1 | 113.0 | 102.3 | 113.6 | 104.9 | 110.6 | 108.4 | 107.5 | 109.1 |
| 8 | Air Transport | 98.7 | 95.4 | 105.0 | 113.3 | 113.3 | 117.3 | 107.0 | 102.0 | 89.9 | 99.9 | 91.2 | 87.8 | 89.2 |
| 9 | Warehousing and support activities for transportation | 114.1 | 120.5 | 119.0 | 117.4 | 131.4 | 126.6 | 121.3 | 151.7 | 113.0 | 124.9 | 128.3 | 127.8 | 126.8 |
| 10 | Postal and Courier | 101.0 | 96.4 | 99.4 | 88.2 | 98.7 | 97.3 | 91.9 | 110.7 | 99.3 | 98.0 | 103.2 | 107.4 | 114.3 |
| 11 | Telecommunications | 108.0 | 110.4 | 112.0 | 109.6 | 118.0 | 118.6 | 112.3 | 121.0 | 118.9 | 114.8 | 118.1 | 121.4 | 120.7 |
| 12 | Information and Broadcasting | 91.9 | 105.2 | 107.4 | 86.5 | 120.2 | 109.5 | 99.8 | 142.1 | 114.0 | 100.8 | 125.1 | 120.8 | 98.6 |
| 13 | Banking | 108.8 | 112.0 | 110.8 | 111.9 | 115.0 | 115.8 | 117.2 | 121.0 | 119.9 | 120.2 | 121.3 | 121.9 | 125.0 |
| 14 | Insurance | 92.6 | 118.0 | 105.6 | 96.1 | 116.0 | 116.9 | 96.9 | 168.1 | 110.9 | 91.1 | 117.4 | 124.1 | 107.9 |
| 15 | Real Estate | 98.0 | 110.4 | 105.4 | 102.5 | 115.3 | 116.2 | 121.3 | 133.0 | 119.8 | 113.3 | 119.0 | 121.2 | 115.3 |
| 16 | IT and computer related services | 102.3 | 121.4 | 109.7 | 107.7 | 137.4 | 111.7 | 109.2 | 146.5 | 112.2 | 109.2 | 130.8 | 119.1 | 116.4 |
| 17 | Professional, scientific & technical services including R & D | 98.8 | 116.5 | 111.7 | 108.5 | 127.5 | 109.4 | 106.0 | 166.8 | 106.3 | 111.7 | 122.7 | 116.2 | 112.7 |
| 18 | Administrative and support services | 105.0 | 120.4 | 115.2 | 104.0 | 122.9 | 115.9 | 106.6 | 156.5 | 120.4 | 106.2 | 121.7 | 134.5 | 118.8 |
| 19 | Arts, Entertainment and Recreation Services | 117.2 | 98.5 | 120.1 | 98.2 | 131.5 | 119.8 | 110.1 | 147.6 | 127.5 | 140.6 | 119.2 | 107.0 | 111.7 |
Among the faster-growing sectors:
- Retail trade: +19.9%
- Repair services and real estate: +17.6% each
- Insurance: +16.5%
- Banking: +14.9%
- Professional, scientific and technical services: +14.2%
- IT and computer-related services: +13.8%
Two sectors shrank: air transport (−9.6%) and arts, entertainment and recreation (−4.7%). Railway transport grew the least among the rest, at 3.7%.
Why it matters
India has long had a monthly index for factory output, but not a comparable monthly measure of services, which make up a large part of the economy. This series is meant to fill that gap.
Read with care
MoSPI says the monthly indices are published on an experimental basis so that it can test data quality and get feedback. The banking, insurance and railway indices use provisional data and will be revised every year. So these figures may change, and month-to-month swings should be read with caution.
Source: official release by the Ministry of Statistics & Programme Implementation, issued through the Press Information Bureau, Government of India (29 OCT 2026 4:00PM by PIB Delhi). Read the full official text: Release of Sub-Sectoral Trial Index of Services Production (ISP) for August 2026 (Base Year 2024–25).
How we verified this
VerifiedEvery fact, figure and quotation is taken from the official PIB release (Release ID 2330036) issued by the Ministry of Statistics & Programme Implementation on 29 OCT 2026 4:00PM by PIB Delhi; checked against the source on publication. Story written by BDT from that release; no outside facts added.
Sources
- 1.Release of Sub-Sectoral Trial Index of Services Production (ISP) for August 2026 (Base Year 2024–25) — Press Information Bureau, Government of India